Time Series Forecasting with a Random Forest (1 of N)
machine-learning time-series random-forests easi I’ve been playing with random forests, experimenting with hyperparameters, and throwing them at all kinds of datasets to test their limitations… But prior to this month, I’d never used a random forest for any kind of time series analysis or forecasting. In a conversation with my brother about recurrent neural nets, I began to wonder if you can get any traction out of a random forest.
The set-up is simple: slice some time series data into overlapping (p+1)-point data windows, use the first p points as inputs, and the end point as the target value. We’ll call this a next-point prediction. You can concoct more complicated set ups, which we do below (e.g., use p points to predict a point another q points into the future).
To play with this, I created some synthetic data. In fact, it might have been too synthetic. It was a purely periodic signal: just a combination of a few sinusoids, a sawtooth wave, and a nigh-trivial dose of noise. Moreover, assuming the sampling rate is 1 Hz (i.e., one data point per second), the periodicities were fairly slow moving – the quickest being a 30-second sine wave, the longest a 30-minute sawtooth.
# Time (in seconds)
t = np.arange(24*3600)

# Signal Components
small_sin = np.sin(2*np.pi*t/30)               # 30 sec
med_cos = 3*np.cos(2*np.pi*t/300)              # 5 min
big_sin = 11*np.sin(2*np.pi*t/1200)            # 20 min
long_saw = 20*signal.sawtooth(2*np.pi*t/1800)  # 30 min
err = 0.75*np.random.randn(len(t))

# Our Signal
sig = small_sin + med_cos + big_sin + long_saw + err
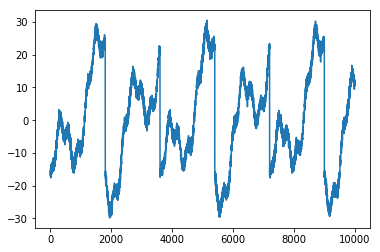
I started off a bit pessimistic: since my sawtooth was 30 minutes, I figured I’d first try a 30-minute window (every 10 minutes is 600 data points at a 1 Hz sampling rate, so this was an 1800-point window). This was likely overkill given I got a R2 score of 99.39%. The regression looked like a nice smooth over the curve.
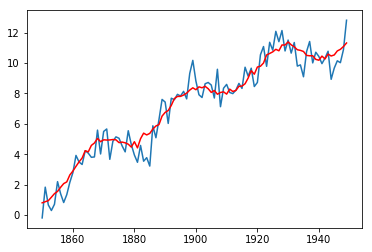
Probably only needed 15 minutes (900-point windows), right?
Wrong: still got an R2 of 99.38%, which means we “only need” less than that:
- 5-minute window (300 data points): 99.32%
- 1-minute window (60 data points): 99.14%
- 30 seconds: 99.12%
- 10 seconds: 99.15%
- 3 seconds: 99.07%
- 2 seconds: 98.96%
At this point, my mind was temporarily blown…until I realized that this makes perfect sense. I mean, look at that smooth on the figure above for the initial 1800-point window. You can get that same smooth by just averaging a few data points right before the one you want to predict.
10-Minute Forecast
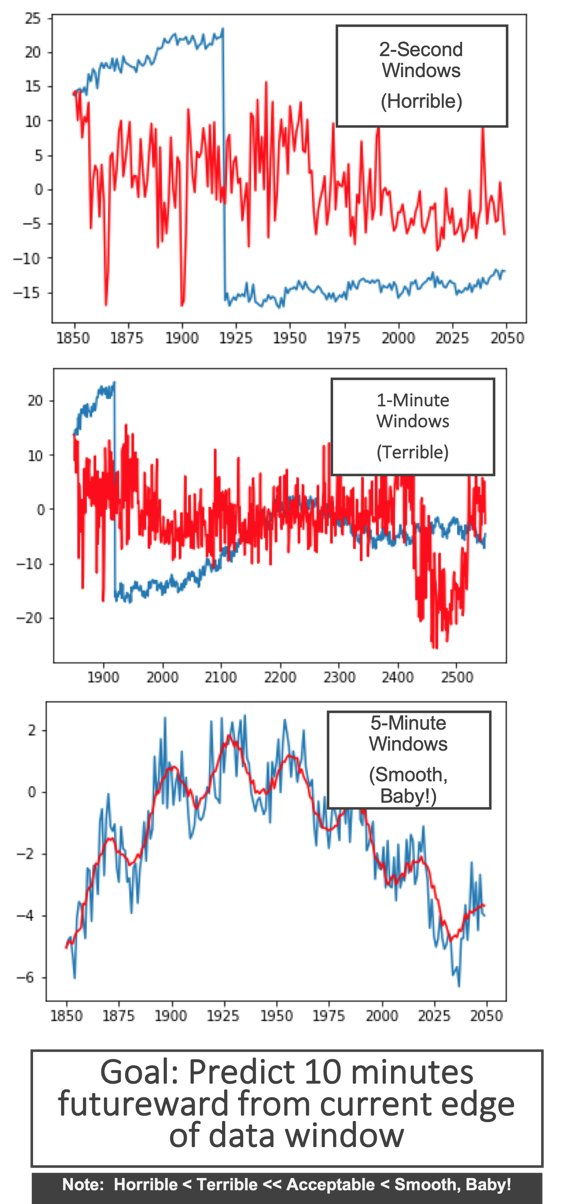
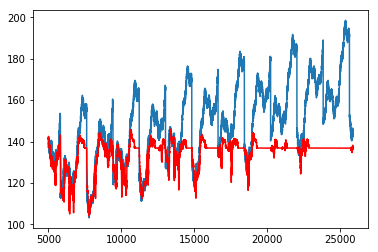
Inability to Extrapolate
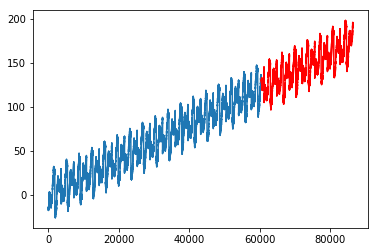
Misc Lessons Learned
I tried a pretty big forest at first, using sklearn’s defaults for the forest’s other hyperparameters…but it was taking so long.
Most of my writing is in the notebook right now… Will update this post later to summarize.
