
First Foray into Data Modeling with Graphs
databases data-modeling easi In a previous post, we used the mighty pen (remember: fuck pencils) and rock-crushing paper to model data using entity relationship diagrams (ERDs). Today, we will use a pencil… Just kidding: today, we will use the pen-and-paper approach to model our data with graphs. Importantly, we will discuss how to translate between ERD and graph models.
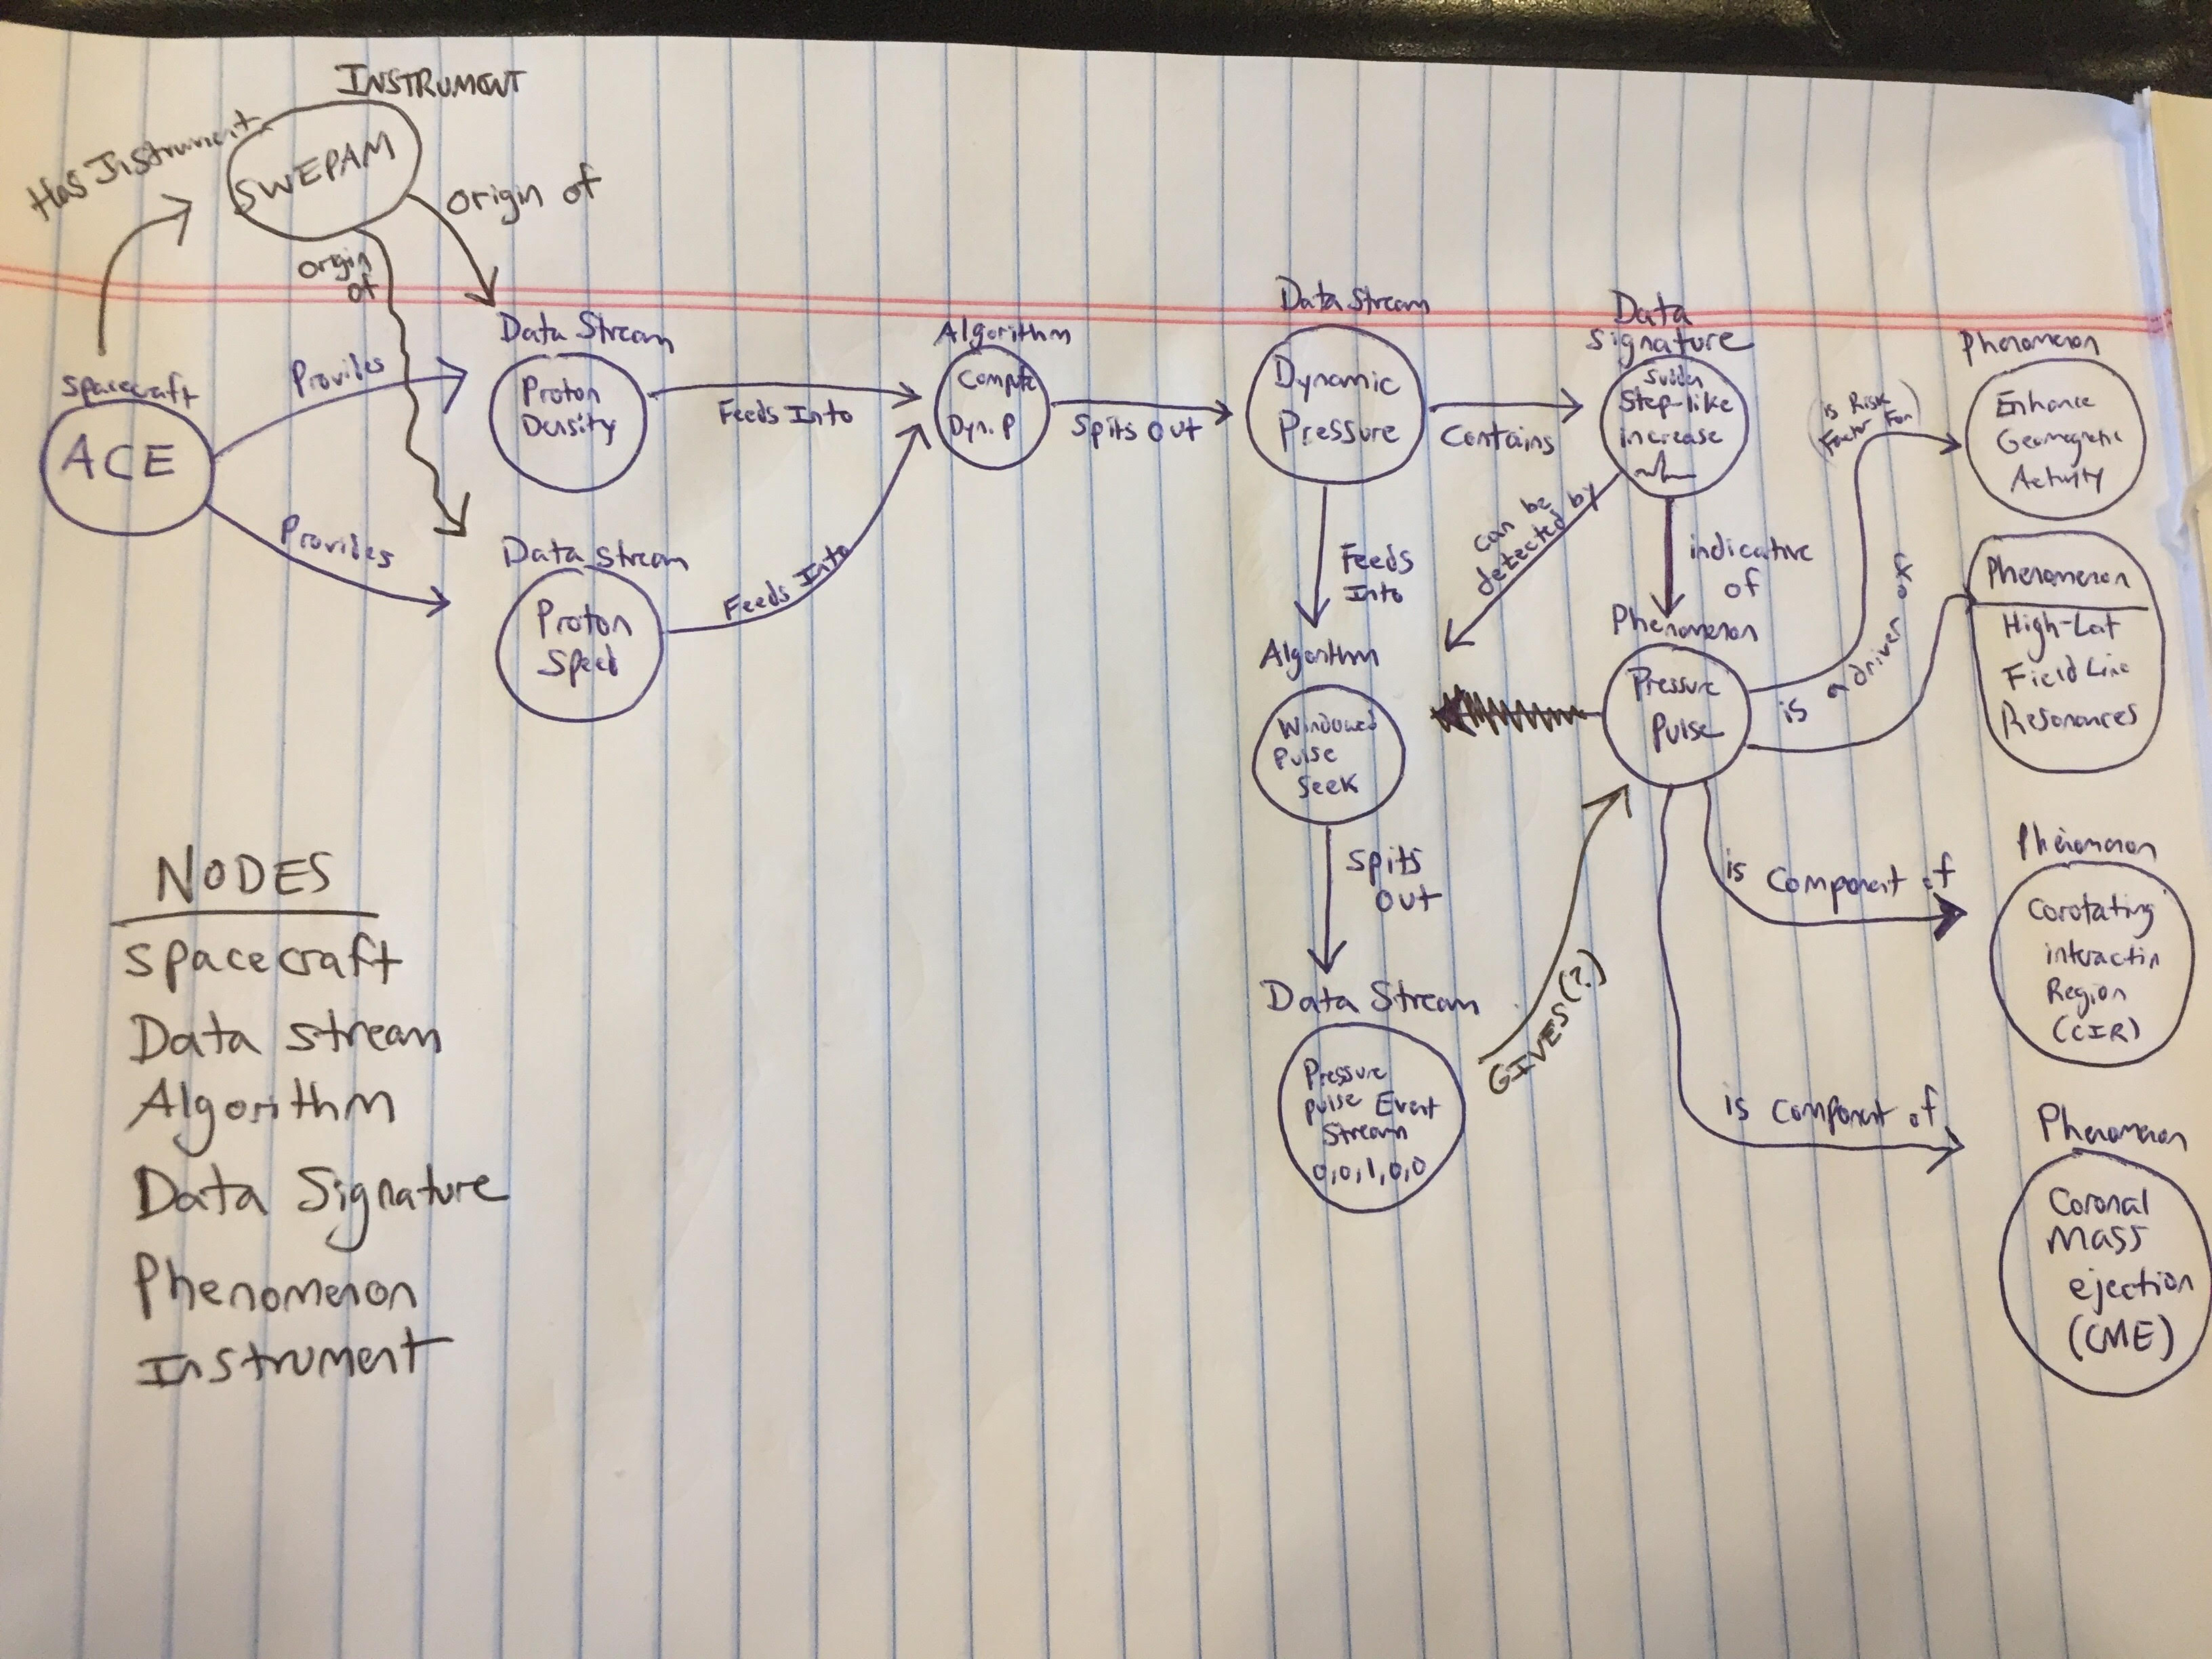
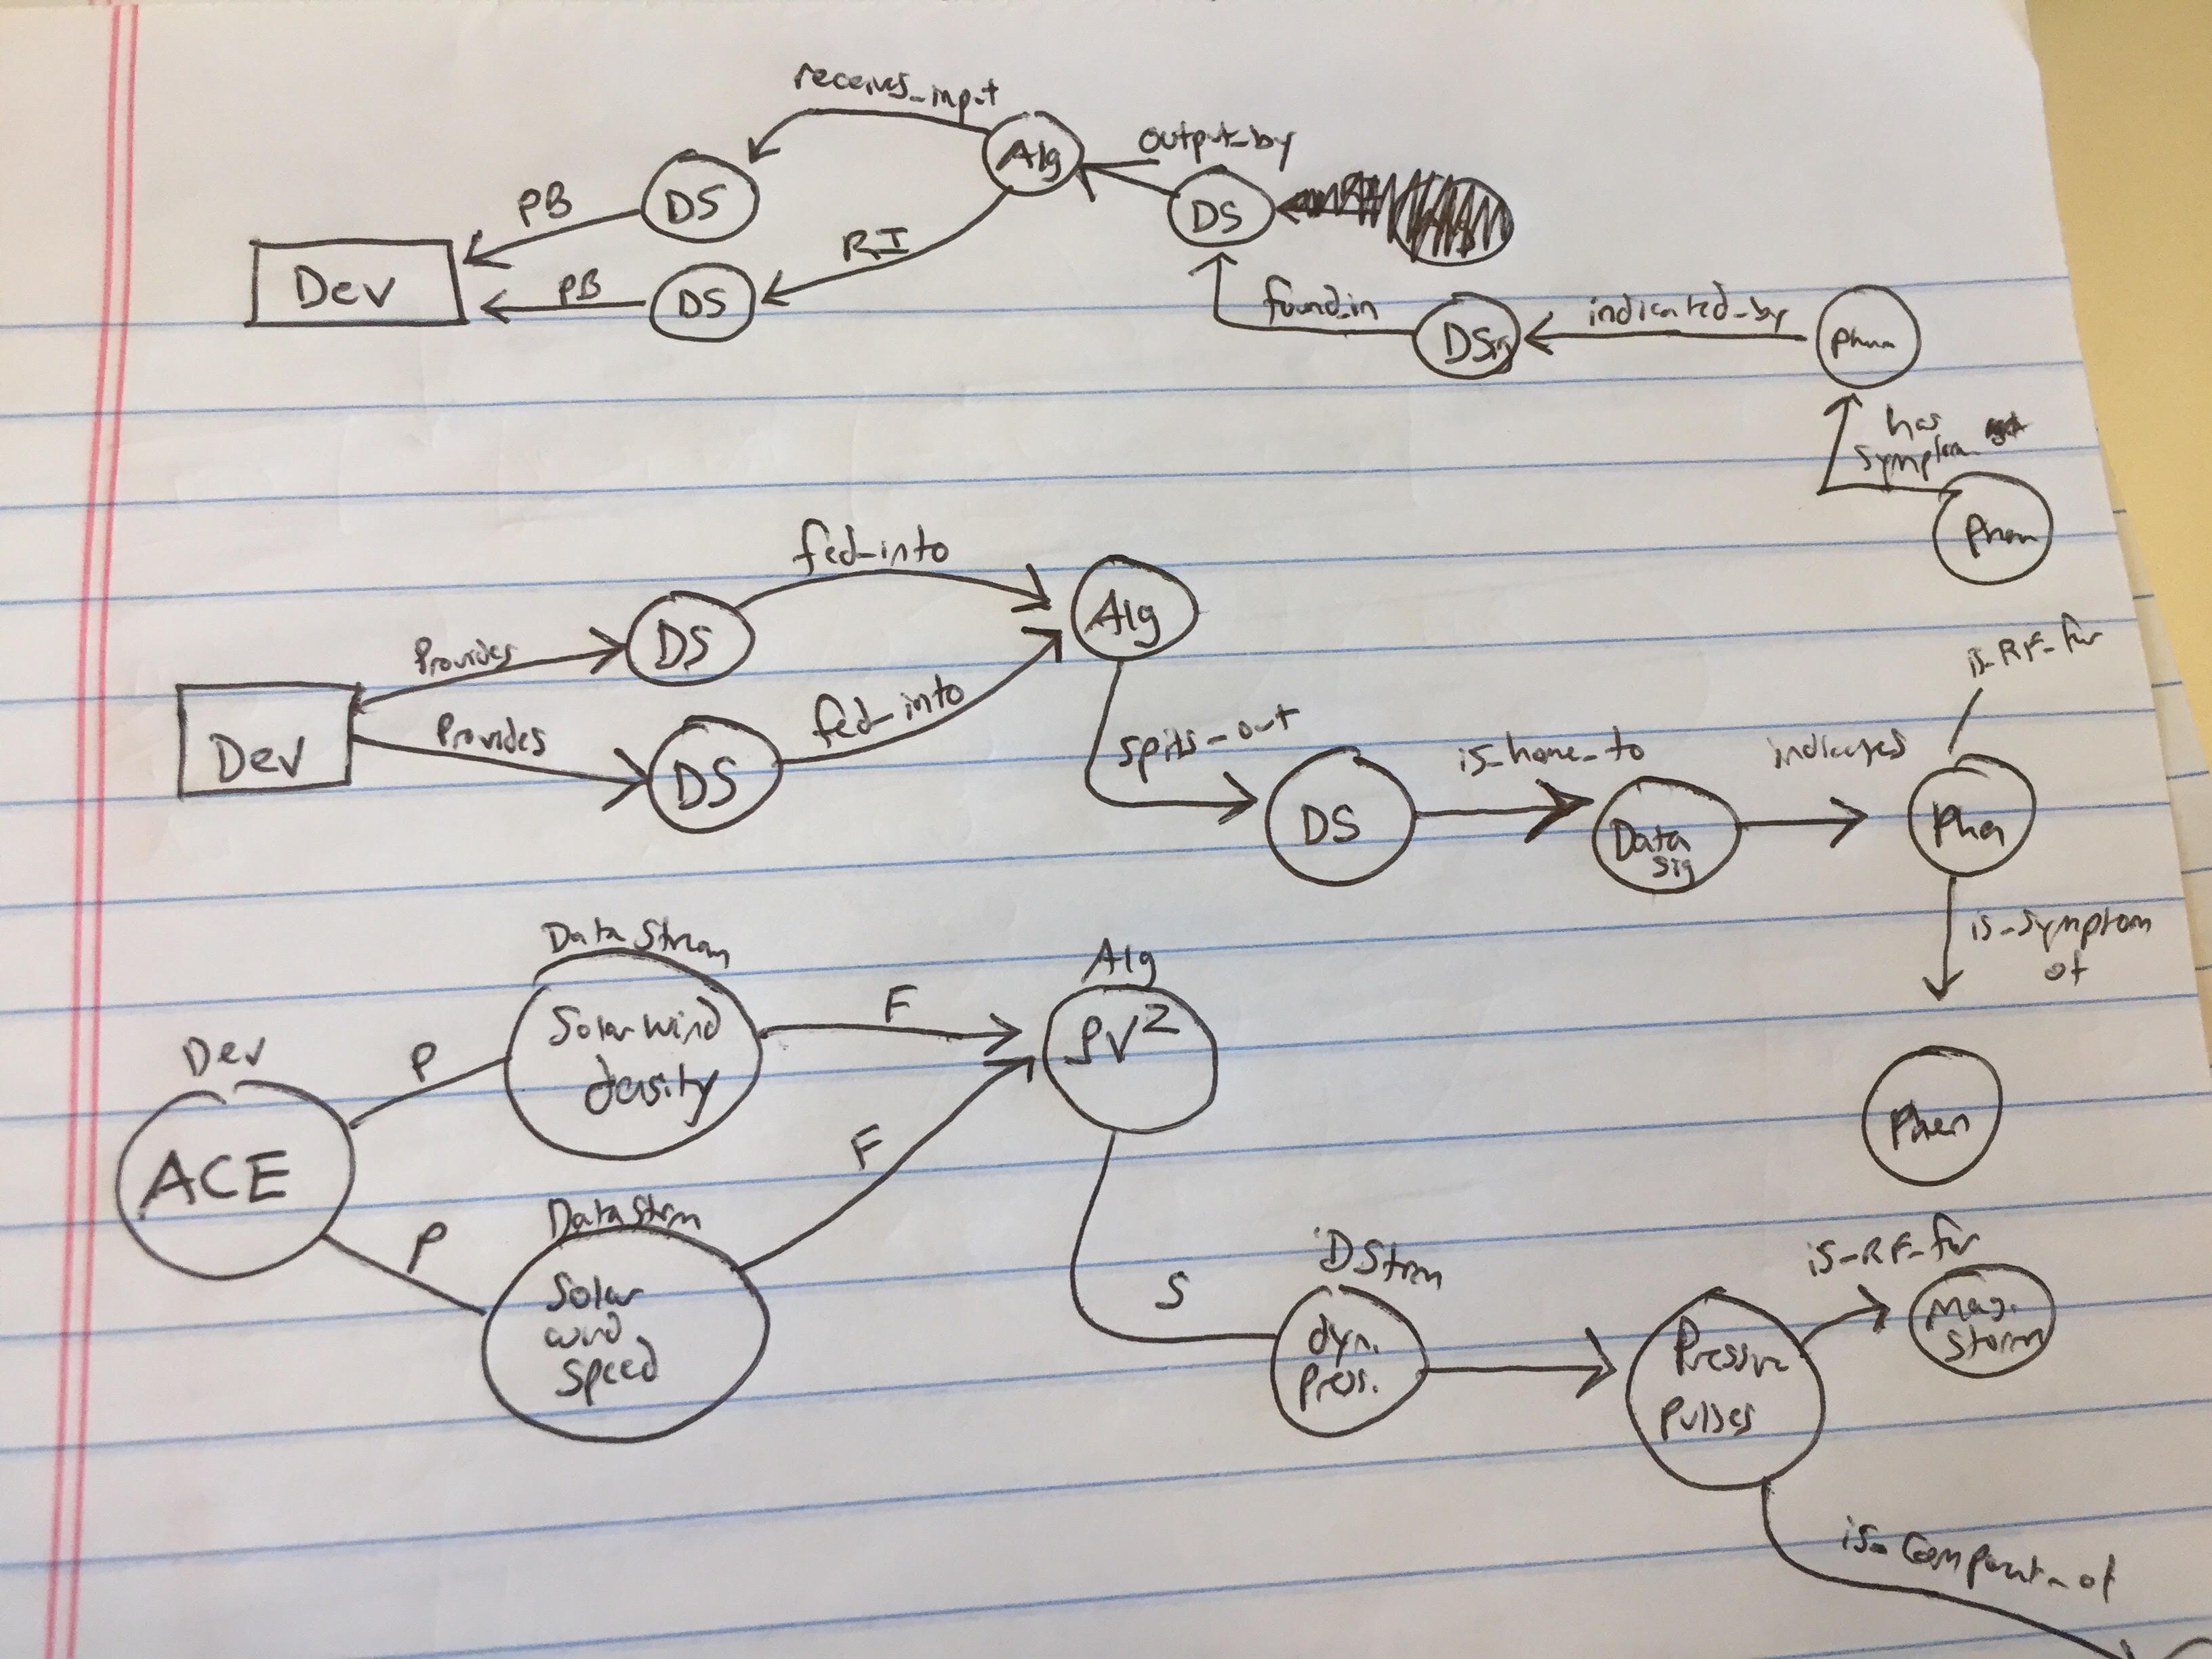
I like graph modeling because it’s easier – there is often little difference between your whiteboard brainstorm, and your final graph model. In traditional data modeling terms, I think this is like saying there is little difference between your “conceptual model” and your “logical model.” My understanding, which may be sketchy, is that if the graph database is a native graph databse (like Neo4j), then this whiteboard model is very close to how the data is even stored on disk – i.e., close to your physical model.
Instead of Automated Geophysical Observatories (AGOs), I use the Advanced Composition Explorer (ACE) as an example here. ACE is a spacecraft that hangs around the L1 point in the Sun-Earth 2-body system. Got it?! Good.
WARNING: Never finished writing this. But the links that are included should be very helpful if you’re curious.
References and Further Reading
Directly Related to this Post
- Neo4j: Graph Modeling Guidelies
- Neo4j: Relational to Graph
- Neo4j: Relational vs Graph Data Modeling
More Loosely-Related / Want to Keep Track Of
- https://neo4j.com/developer/guide-importing-data-and-etl/